

Table of Contents
Mastering XAU/USD Analysis For Modern Traders
The Core Fundamental Drivers Of Gold
Technical Indicators For Precision Trading
Putting It All Together in a Real Trading Plan
Final Thoughts
FAQs
Gold has always held a strange kind of power over financial markets. It's part commodity, part currency, part historical relic, and yet it moves billions of dollars every single day. For anyone trading XAU/USD seriously, a quick chart glance or a news headline isn't enough. You need to look at gold through two lenses at once: the big-picture economic forces shaping its long-term direction, and the price behavior that tells you when to act. Put those two together, and you stop guessing; you start trading with actual conviction.
Mastering XAU/USD Analysis For Modern Traders
The core difficulty with gold is how many things pull at its price simultaneously. It doesn't have earnings reports or quarterly dividends like a stock. Its value is essentially a running verdict on everything else happening in the world - the strength of the dollar, the mood of global investors, the actions of central banks.
When you sit down to analyze XAU/USD, you're really asking two questions: How healthy is the US dollar right now? And how nervous or confident are investors globally? Whether you're putting together a short-term outlook for next week or a broader view through year-end, the traders who get it right are the ones who connect the why (fundamentals) with the when (technicals).
The Core Fundamental Drivers Of Gold

Fundamental analysis in gold is about understanding what actually drives value over time. These are the factors that create the underlying current, the ones that determine whether gold has the energy to sustain a move or whether it's running on fumes.
Inflation And Real Yields
Of all the forces acting on gold, the relationship between inflation and interest rates is the most important. Gold has a long reputation as an inflation hedge, and that reputation is largely deserved, but the real mechanism is real yields, which are just the interest rate minus the inflation rate.
When real yields are low or negative, there's almost no cost to holding gold instead of interest-bearing assets. That makes gold attractive. When the Federal Reserve starts pushing rates higher to cool inflation, those real yields rise, and gold tends to come under pressure, because now you're giving up real income by holding it.
The US Dollar And Geopolitical Risk
Gold is priced in US dollars, so the two have a natural tug-of-war relationship. A stronger dollar generally weighs on gold prices; a weaker dollar tends to lift them. That's the baseline.
But layered on top is geopolitical risk. When the world feels unstable, whether from conflict, financial crises, or political upheaval, investors pour money into gold as a form of capital protection. These moments can produce sharp, sudden price spikes that seem to ignore all normal economic logic. That's not irrational behavior; it's the market putting safety above profit.
Central Bank Gold Reserves And Physical Demand
Physical demand matters more than many traders realize. Over the past several years, central banks, especially in China and India, have been buying gold at historically high levels, deliberately diversifying their reserves away from the dollar. That kind of institutional buying creates a structural floor under the market.
Add to that the seasonal demand from both countries for gold jewelry and private investment, and you have a consistent source of buying pressure that can keep prices from falling too far, even when the technical picture looks weak.
Technical Indicators For Precision Trading
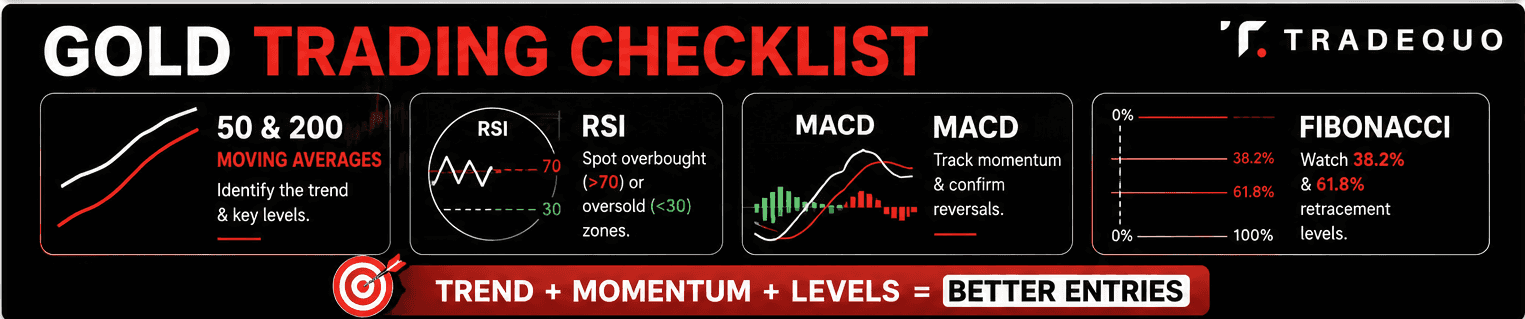
If fundamentals tell you what to trade, technical analysis tells you where and when. By studying price behavior on a chart, you can see where large market participants are positioning themselves and use that information to make sharper decisions.
Moving Averages And Trend Analysis
Moving averages are the foundation of trend analysis for most gold traders. The 50-day and 200-day moving averages are the ones to watch. When the shorter average crosses above the longer one, it often signals the beginning of a sustained upward move. These levels also act as dynamic support and resistance; prices frequently pause or bounce when they reach these zones during a pullback.
Momentum Oscillators: RSI And MACD
Two indicators help traders measure the strength behind a price move. The RSI (Relative Strength Index) shows whether gold is overextended to the upside (above 70) or downside (below 30). In a strong bull run, gold can stay in overbought territory for longer than you'd expect, so RSI readings are most useful for spotting pullback opportunities within a larger trend.
The MACD tracks the relationship between two moving averages and gives you a read on momentum and possible reversals. When used alongside RSI, it adds another layer of confirmation before entering a trade.
Fibonacci Retracements And Chart Patterns
After a significant rally, gold rarely goes straight up forever. It tends to pull back to predictable levels, often the 38.2% or 61.8% Fibonacci retracement, before resuming its trend. These levels function as psychological checkpoints for the market.
Pair those with recognizable chart patterns like the Head and Shoulders or Cup and Handle, and you have a visual framework for understanding where sentiment is shifting. Candlestick patterns add further detail, showing how buyers and sellers are fighting it out within individual trading sessions.
Putting It All Together in a Real Trading Plan
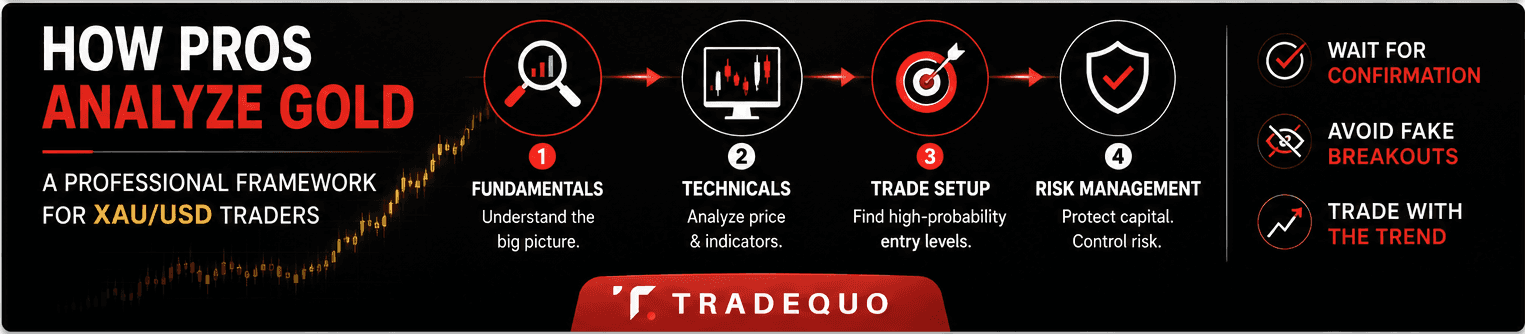
The strongest gold trading strategies don't pick one approach over the other. They use fundamentals to set the direction and technicals to find the entry. Think of it this way: fundamentals are the wind, and technical levels are the waves. Sailing is easier when both are working in your favor.
Trading The News With Technical Levels
Here's a scenario that plays out regularly: the Federal Reserve signals it's pausing rate hikes, which is fundamentally positive for gold. Before jumping in, a trader checks the chart. If the price is sitting right at a key support level at the same moment the fundamental backdrop turns bullish, the odds of a successful trade go up considerably. That overlap of signals is what most experienced traders are hunting for.
Identifying Market Volatility
Gold's volatility often comes from moments when technicals and fundamentals are pointing in opposite directions. If the fundamental picture strongly favors gold, say, recession fears are rising, and demand is surging, but the price is pressing against a major multi-year resistance level, it pays to wait. You want both signals aligned. When only one is present, you're more exposed to a fake breakout: the price spikes on a news event, then quickly reverses, taking out stops along the way.
Recent Market Moves
Consider a situation from the past year where inflation data came in higher than expected. That reading was initially positive for gold. But markets also started pricing in a Fed response, likely rate hikes, which pushed the dollar higher. Now the fundamental signals were pointing in two directions at once.
Here's where technical analysis cuts through the noise. If gold held above its 200-day moving average despite dollar strength, that's a meaningful signal. It suggests that buyers, likely central banks accumulating on dips, were absorbing the selling pressure. A bull flag pattern forming on the daily chart during that same period would have given a technical basis for projecting a move toward new all-time highs.
Watching how the Fed responded while also respecting what the chart was showing - that combination is what separates disciplined traders from reactive ones.
Final Thoughts
Becoming consistently profitable in gold takes time and honest observation. Whether you're doing a full multi-timeframe analysis or just checking momentum indicators for a quick setup, remember that gold is a market of layers. No single data point, indicator, or headline tells the whole story.
The more time you spend watching how macroeconomic shifts interact with price behavior on the chart, the more that "feel" for the market develops, and it's something no algorithm can replicate. TradeQuo’s advanced charting platform lets you overlay technical indicators with fundamental context, making it easier to see both pictures at once. That's where the edge is.
FAQs
What affects the gold price the most?
The most significant drivers are real interest rates, the strength of the US dollar, and geopolitical stability. Gold typically moves inversely to the US dollar and real yields, acting as a refuge during times of economic or political stress.
How to analyze the gold price for short-term trading?
For short-term moves, traders focus heavily on technical analysis. Using indicators like the RSI, MACD, and 5-minute or 15-minute candlestick patterns helps identify intraday momentum and entry points around established support and resistance levels.
Is gold a safe haven asset in 2026?
Historically and currently, gold remains the premier safe haven. Its lack of counterparty risk makes it a preferred asset during banking crises, high inflation, or periods of significant global conflict, as it tends to retain value when paper assets decline.
How does inflation impact the gold price specifically?
Inflation devalues fiat currency, which usually leads to higher gold prices as investors seek to preserve their purchasing power. However, if inflation leads to aggressive interest rate hikes, the resulting high real yields can sometimes temporarily dampen gold's appeal.
What indicators are best for gold trading on XAU/USD?
Most professionals use a combination of the 50-day and 200-day Moving Averages for trend direction, the RSI for overextended conditions, and Fibonacci Retracements to find potential areas where the price might pull back before continuing its trend.